When solving problems in a quality improvement or any other situation, tools and a structured framework are often used to help reach good decisions, but they alone are not enough. Whilst structure and tools may be considered as the engine of problem solving, they need the fuel of data to be effective. The confidence that can be put in any decision and the quality of the result are proportional to the accuracy of the information upon which the decision was based.
The three sections of this chapter looks at ways to help find the right information that will enable effective decisions to be made.
In any problem-solving or tool-usage situation, a desirable outcome may be described in the form of a statement of objectives. Sometimes this is implicit, but it is usually worth writing down in a short sentence, as this will help to achieve consensus within the project group, acting as a 'guiding star' for decisions and actions. One of those actions will be the collection of data in order to demonstrate whether objectives have been met. It makes sense if the statement is worded in a way that helps that data to be clearly identified.
For example, when setting the objective of an improvement project, the specifics of what is to be improved may be included in the objectives statement, such as, 'Increase the accuracy and timeliness of the order processing system'. In this case it is clear that accuracy and timeliness must be measured.
When planning a project, even when using objectives, it may not always be clear what should be measured. A simple and effective approach to this is called the goal-question-metric paradigm, which uses a question as a bridge between objectives and measures. The approach is to ask questions about objectives that may help measures to be identified, particularly 'How will I know how well the objective is being approached?' and 'How will I know when the objective has been met?'. Other useful measures may be found by asking questions such as: 'How many?', How much?', 'When?', 'How useful?', 'How expensive?', 'How often?', 'Who?'.
For example, if the objective is 'make a better cake', then the questioning step may ask, 'How will I know a better cake?' and 'Who can tell me?', which then leads to measures such as comparison against a benchmark or focus group consensus.
In measuring any process, there are two common reasons why measurements are made, being either an ongoing monitoring measurement or a more specific investigative one.
Monitoring measurements act as indicators of the general health of the process, much as temperature gives an overall indication of the health of the human body. The measurement is made over a long period, so that trends and variation can be understood and points where specification limits or target values are exceeded may be identified.
Several considerations should be taken into account when identifying monitoring measurements:
Investigative measurements are made specifically to find out more about known problems or causes. This may be likened to specific medical tests such as measuring blood pressure. The limited nature of an investigative measurement means that it may differ from monitoring measurement in several ways:
The measurement may be intrusive.
The cost of measurement is not particularly important.
Many different measurements may be made, where each measurement covers a specific area in more detail.
Measurements may be more successfully selected and applied if their different parts and classifications are first understood. This section looks at aspects of measurements that may be taken into account when using them.
Information gathered may be of two broad types: quantitative or qualitative. Each has its value, but they may be gathered and treated quite separately.
The easiest type of information to measure and use is a numeric quantity. Numbers are precise and help clear decisions to be made. Tools which use quantitative data often work by using a combination of mathematical calculation and comparison of numbers against one another or against a fixed and critical value.
Most of the discussion in this chapter is about quantitative information.
Quantitative data is not always available and not always enough. Qualitative information is non-numeric, typically appearing as written text. This often comes in 'chunks', where a phrase or sentence describes a single, independent piece of information. Tools which use qualitative data typically organize and structure these chunks relative to one another, thus revealing further information.
Often, a situation is best described by a combination of numeric and non-numeric information, where the qualitative text helps to put the quantitative numbers into context, for example describing who was using a machine, where, under what conditions, etc.
When identifying what to measure, two main types of data should be taken into consideration, as each has applications where it is more useful.
One of the simplest measurements that can be made in many situations is to count the number of items in a particular classification, such as the number of customers purchasing full insurance cover or the number of defects in each sheet of glass. This attribute measurement answers the question, 'How many?' and its simplicity often makes it a good starting point, with variable measurement being used when the problem area has been more narrowly identified.
Attributes are a good way of turning qualitative data into quantitative data, for example by counting employees who think they are significantly underpaid.
Beyond attribute measurement is variable measurement, where the question, 'How much?' is asked. Variable measurements have units, such as centimeters and kilograms. They also usually require more effort to collect than attributes, and the actual measurement usually requires the use of some form of measuring instrument.
In any measurement, there are several components that must be taken into account when deciding what to measure.
The measurement will be made in some kind of units. These should reflect the range of possible values, for example it is probably better to measure the length a piece of wood in millimeters rather than centimeters. Clearly stating the units to be used prevents situations where different people use different units and cause confusion in calculations and displays.
Many measurements are made in the form of numbers, as this is an absolute and flexible format, and the scale is simply the possible range of measured values. In some situations, however, numbers are not so useful, for example when identifying the possible actions of a customer upon finding a defective product.
In this case, the measurement scale is typically made up of a defined and discrete set of values. This can be useful when numbers are unclear, and it is easier to describe your satisfaction as 'high' or 'low' rather than '1' or '5'.
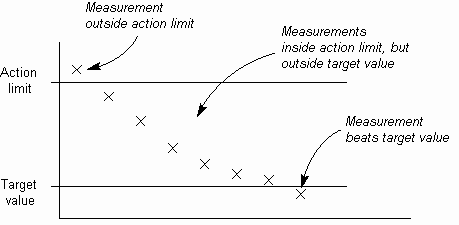
There is often a target or goal value for the measurement. This may be a center value about which the measurement varies, or a distant target that is to be achieved, as in the figure below. The measurement can thus be usefully expressed as a difference from this ideal, rather than as an absolute value.

As well as a target value, there are often some kind of action limits, beyond which the measurement should not go. If the measured value falls outside such specification limits, then some kind of action may be defined, such as rejection of the measured item or an investigation into the cause of failure. On the other hand, it is desirable to beat target values.
The measurement may be made using some kind of measuring device. It is essential that this tool is accurate and reliable, as an uncertain measuring tool will result in worthless measurement values. Measurement tools include all methods of gathering data, from voltmeters to surveys. Each has constraints in use and the data given must be of a known accuracy to enable confident decisions to be made.
If the measurement process is clear and well defined, then each measurement can be made in a consistent way, enabling successive values to be compared. Detailing the process also puts into perspective the actual work that has to be done to collect the data, and enables the requisite time and resource to be scheduled.
Details of the measurement process may include:
When taking measures, there are several approaches which can help to ensure that the right data is selected and collected in a way that helps with the subsequent analysis.
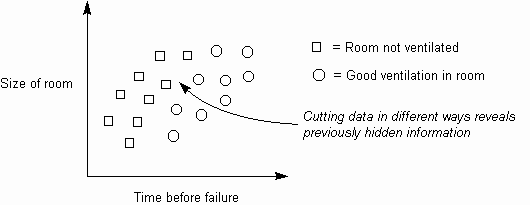
When investigating a problem, a single general measurement is often insufficient and can cloak useful information. By measuring the situation in a number of different ways (stratifying or segmenting it), one or more 'cuts' may reveal new information that will allow specific corrective action to be identified, as in Fig. 1.
Common measurements used in stratifying data include:

Fig. 1. Significant stratification in a Scatter Diagram
For example, a customer support organization counts the number of calls about each product, and find that a heater product is receiving a very high call rate. They have identified a problem, but cannot find out why without making more measurements. They therefore stratify the calls by taking intrusive measures, asking customers questions about suspected causes, such as the type of problem (failure, cutout, etc.), customer (age, occupation, etc.), how they are using the product (indoors/outdoors, hours of usage per day, etc.) and so on.
In order to know exactly how a set of measured items behaves, they must all be measured, such as when determining the distribution of the values of a batch of electrical resistors. However, this is seldom possible, for several possible reasons:
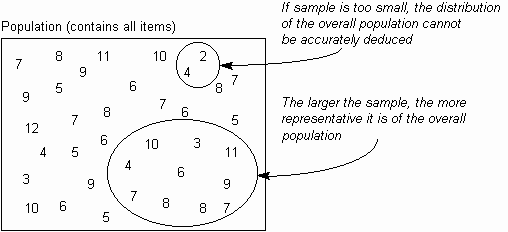
In such cases, a limited sample may be measured, from which the characteristics of all other items (the population) are deduced. In order to be able to do this reliably, there are two factors that must be taken into account:

Fig. 2. Using a sufficient sample size
Most tool descriptions identify the size of samples that need to be taken to ensure a representative sample, so knowledge of statistics is not essential, although a deeper understanding in this area (or access to someone with this knowledge) can be very useful.
For more information on sampling calculations, go Google!
When actually measuring data, it is important that the accuracy of the data is maintained through careful measurement and accurate instruments. This is best achieved through the use of a clearly defined data collection process.
It is usually useful to collect not only the data that is to be used, but also information about the situation in which it was collected. This may include:
Where the data is to be collected by hand, then a Check Sheet may be designed to ease both the recording and interpretation of data.
A variable often overlooked when recording data is the person doing the job. The best way of reducing any potential variation from this source is through training. This need not be complex or long, but it should be enough for the person to understand how to use any instruments, operate any machines and reliably record all requisite data. It can help if they know how the information is likely to be used afterwards, as a fear that the information may be used to their disadvantage can tempt them to tamper with it.