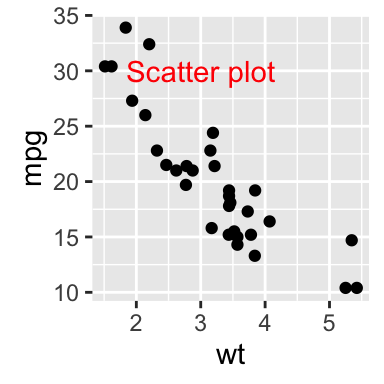
Text annotations using geom_text and geom_label
library(ggplot2)
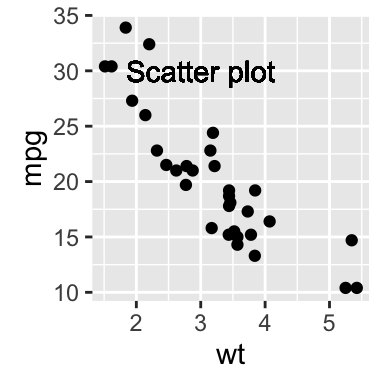
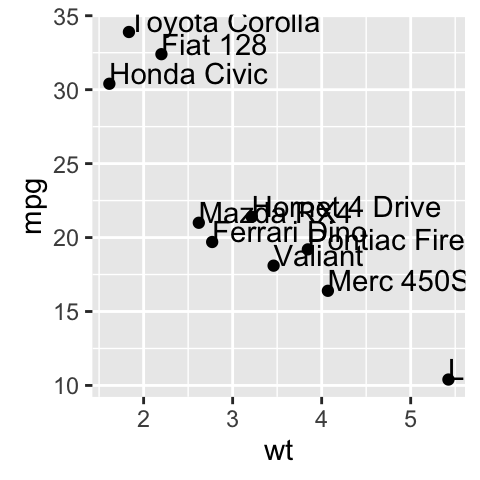
# Simple scatter plot
sp <- ggplot(df, aes(wt, mpg, label = rownames(df)))+
geom_point()
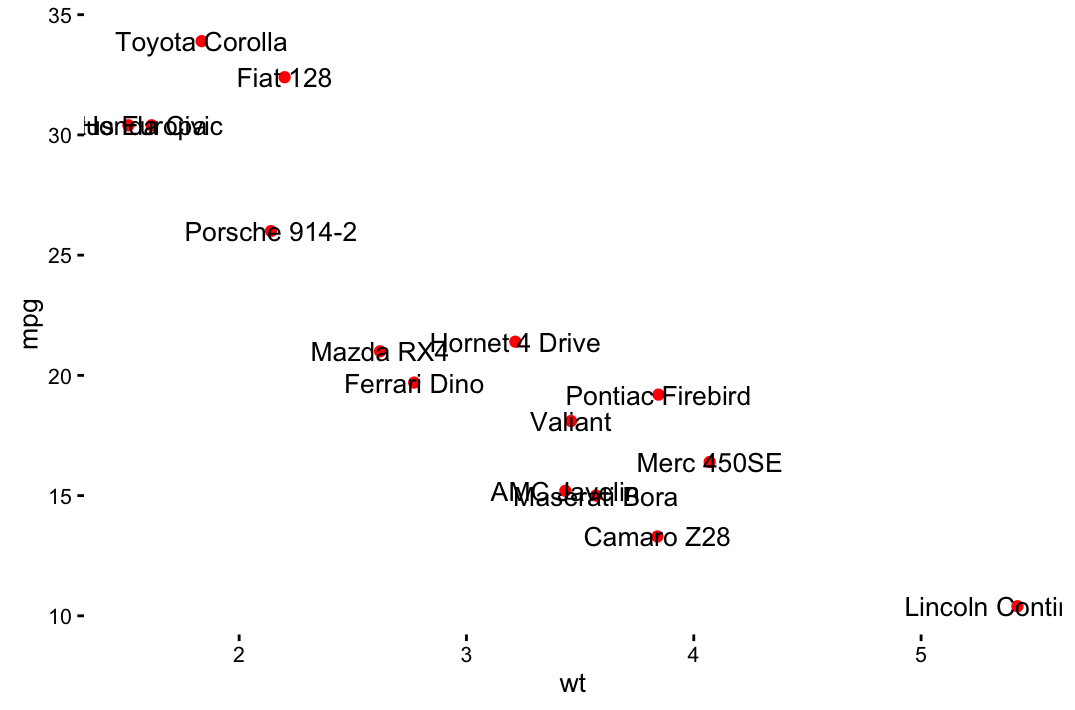
# Add texts
sp + geom_text()
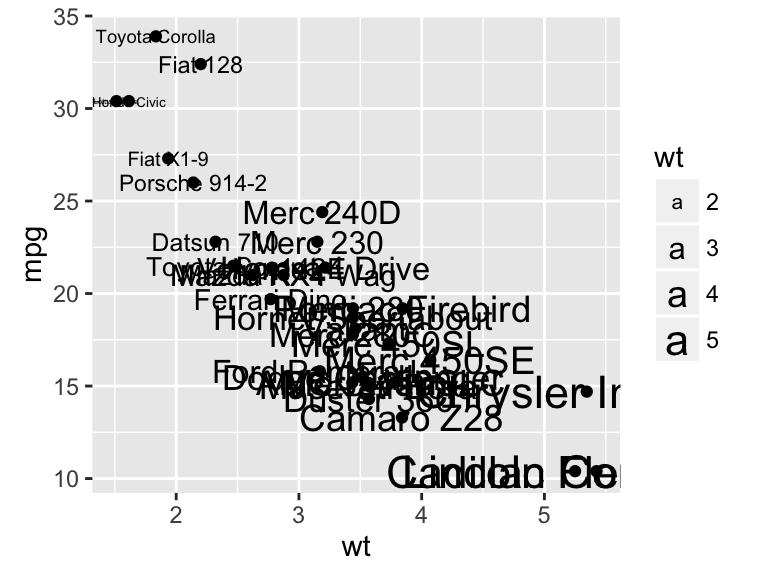
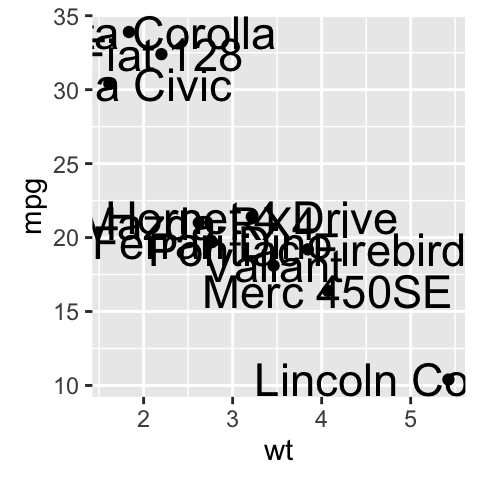
# Change the size of the texts
sp + geom_text(size=6)
# Change vertical and horizontal adjustement
sp + geom_text(hjust=0, vjust=0)
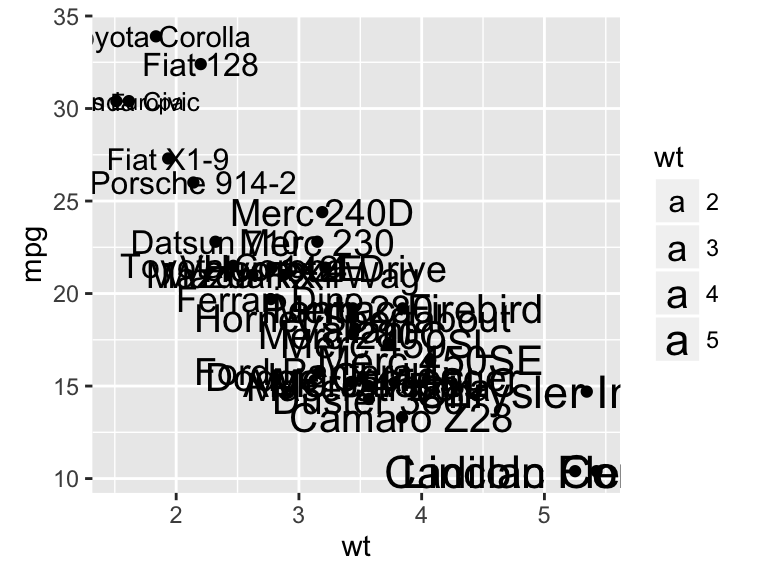
# Change fontface. Allowed values : 1(normal),
# 2(bold), 3(italic), 4(bold.italic)
sp + geom_text(aes(fontface=2))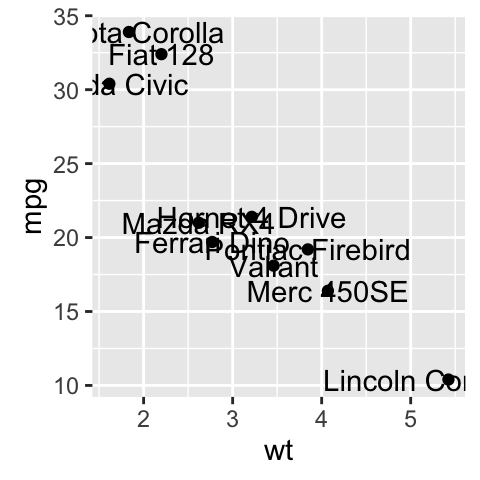
- Change font family
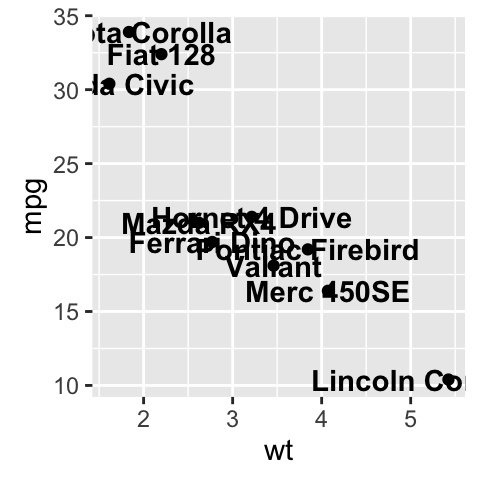
sp + geom_text(family = "Times New Roman")- geom_label() works like geom_text() but draws a rounded rectangle underneath each label. This is useful when you want to label plots that are dense with data.
sp + geom_label()
Others useful arguments for geom_text() and geom_label() are:
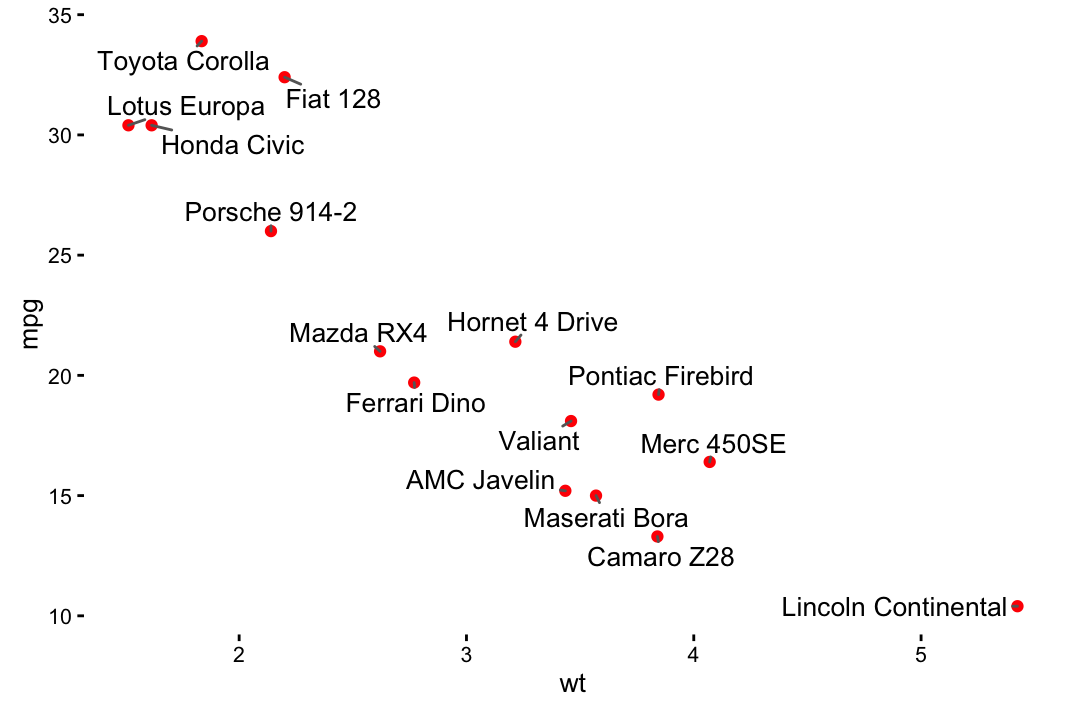
- nudge_x and nudge_y: let you offset labels from their corresponding points. The function position_nudge() can be also used.
- check_overlap = TRUE: for avoiding overplotting of labels
- hjust and vjust can now be character vectors (ggplot2 v >= 2.0.0): left, center, right, bottom, middle, top. New options include inward and outward which align text towards and away from the center of the plot respectively.